
CareSens Air App
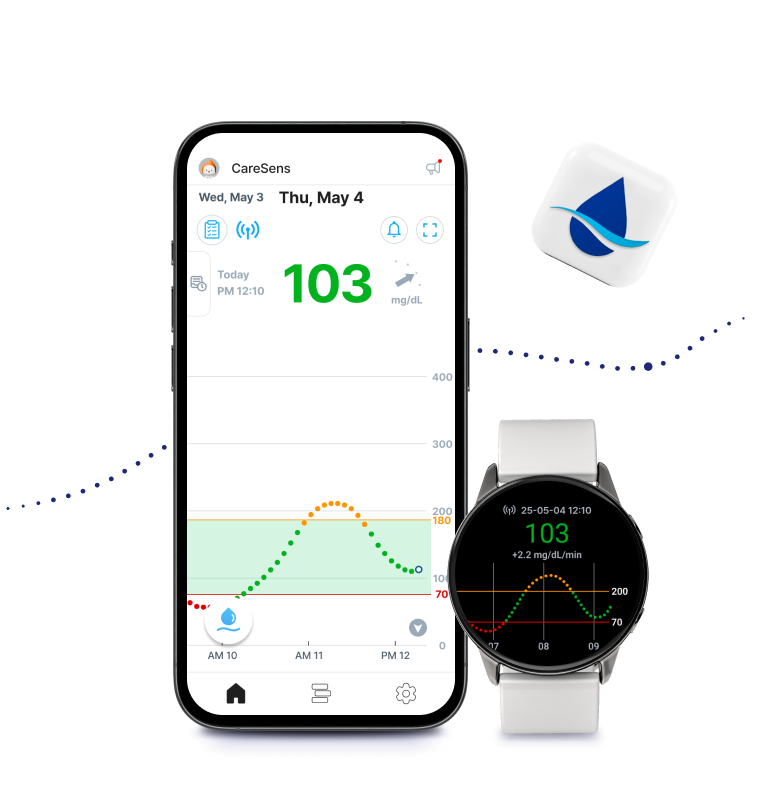
Start managing your glucose in real time with the CareSens Air app.
CareSens Air App
Start effective glucose management with the CareSens Air app.
Check the flow of glucose values changing over time in a graph, and check the speed and direction of change in your glucose using the trend arrows.
Understanding your glucose trends can help you prevent your glucose values from falling out of your target range.
Understanding your glucose trends can help you prevent your glucose values from falling out of your target range.


* The app in the image is for illustration purposes only
and may differ from the actual app screen depending on the software version.
Check glucose trends in real time.
Check the flow of glucose values changing over time in a graph, and check the speed and
direction of change in your glucose using the trend arrows.
Understanding your glucose trends can help you prevent your glucose values from falling
out of your target range.
direction of change in your glucose using the trend arrows.
Understanding your glucose trends can help you prevent your glucose values from falling
out of your target range.
* If physical symptoms appear unrelated to the readings, testing with a personal blood glucose meter may be necessary to ensure the safety of treatment.
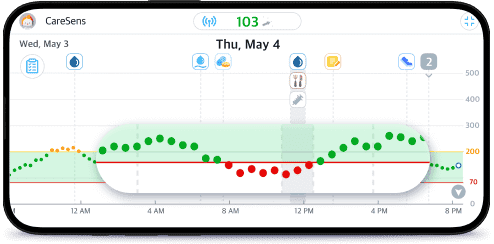
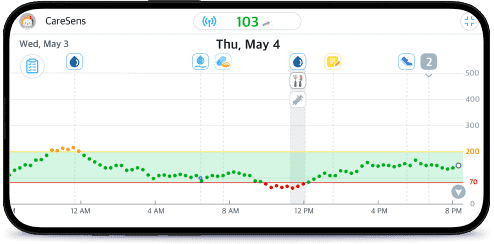
Glucose Graph
- It's easy to track the trend of your glucose over time with a quick glance at the graph.
- Simply tap on any dot on the graph to view the corresponding glucose value at that specific time.
- Additionally, the vertical screen displays 24-hour statistics, while the horizontal screen shows statistics for the entire tracking period.
* The app in the image is for illustration purposes only and may differ from the actual app screen depending on the software version.
Trend arrows
|
Stable |
The glucose level has been increasing or decreasing below 30 mg/dL (1.6 mmol/L) in the past 30 minutes. | |
|---|---|---|
|
Increasing slowly |
Decreasing slowly |
The glucose level has been increasing or decreasing by 31–60 mg/dL (1.6–3.3 mmol/L) over the past 30 minutes. |
|
Increasing |
Decreasing |
The glucose level has been increasing or decreasing by 61–90 mg/dL (3.4–5.0 mmol/L) over the past 30 minutes. |
|
Increasing rapidly |
Decreasing rapidly |
The glucose level has been increasing or decreasing by more than 91 mg/dL (5.1 mmol/L) in the past 30 minutes. |


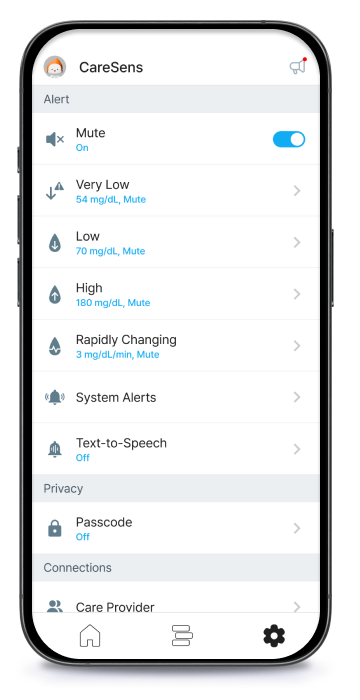
Don't miss out on important glucose events by setting up glucose alerts.
Customize your alert preferences based on your glucose management goals.
Set specific thresholds for very low, low, high, and rapidly changing levels for each glucose event.
Additionally, you can opt for Mute when you don't need any notifications to sound.
Set specific thresholds for very low, low, high, and rapidly changing levels for each glucose event.
Additionally, you can opt for Mute when you don't need any notifications to sound.
* Signal Loss, Sensor Error, Sensor Warmup, Sensor Expiration alerts must be separately muted to stop the alerts from sounding.
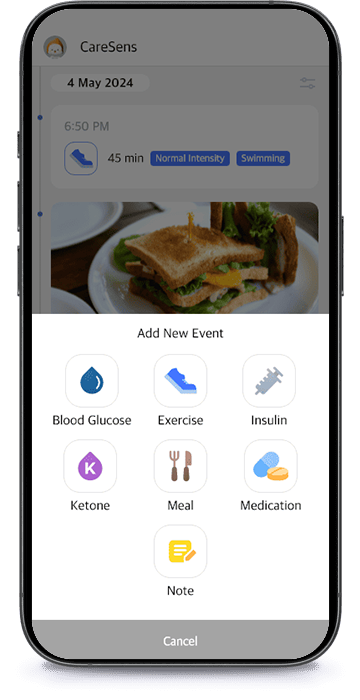
Start managing your glucose
effectively with
lifelog event logs.
effectively with
lifelog event logs.
Enter lifelog events for activities and situations that can affect your glucose values.
Understanding the difference between your glucose values before and after an event on your glucose graph can help you control your glucose.
Keep a steady record to find your own patterns of glucose changes.
Understanding the difference between your glucose values before and after an event on your glucose graph can help you control your glucose.
Keep a steady record to find your own patterns of glucose changes.